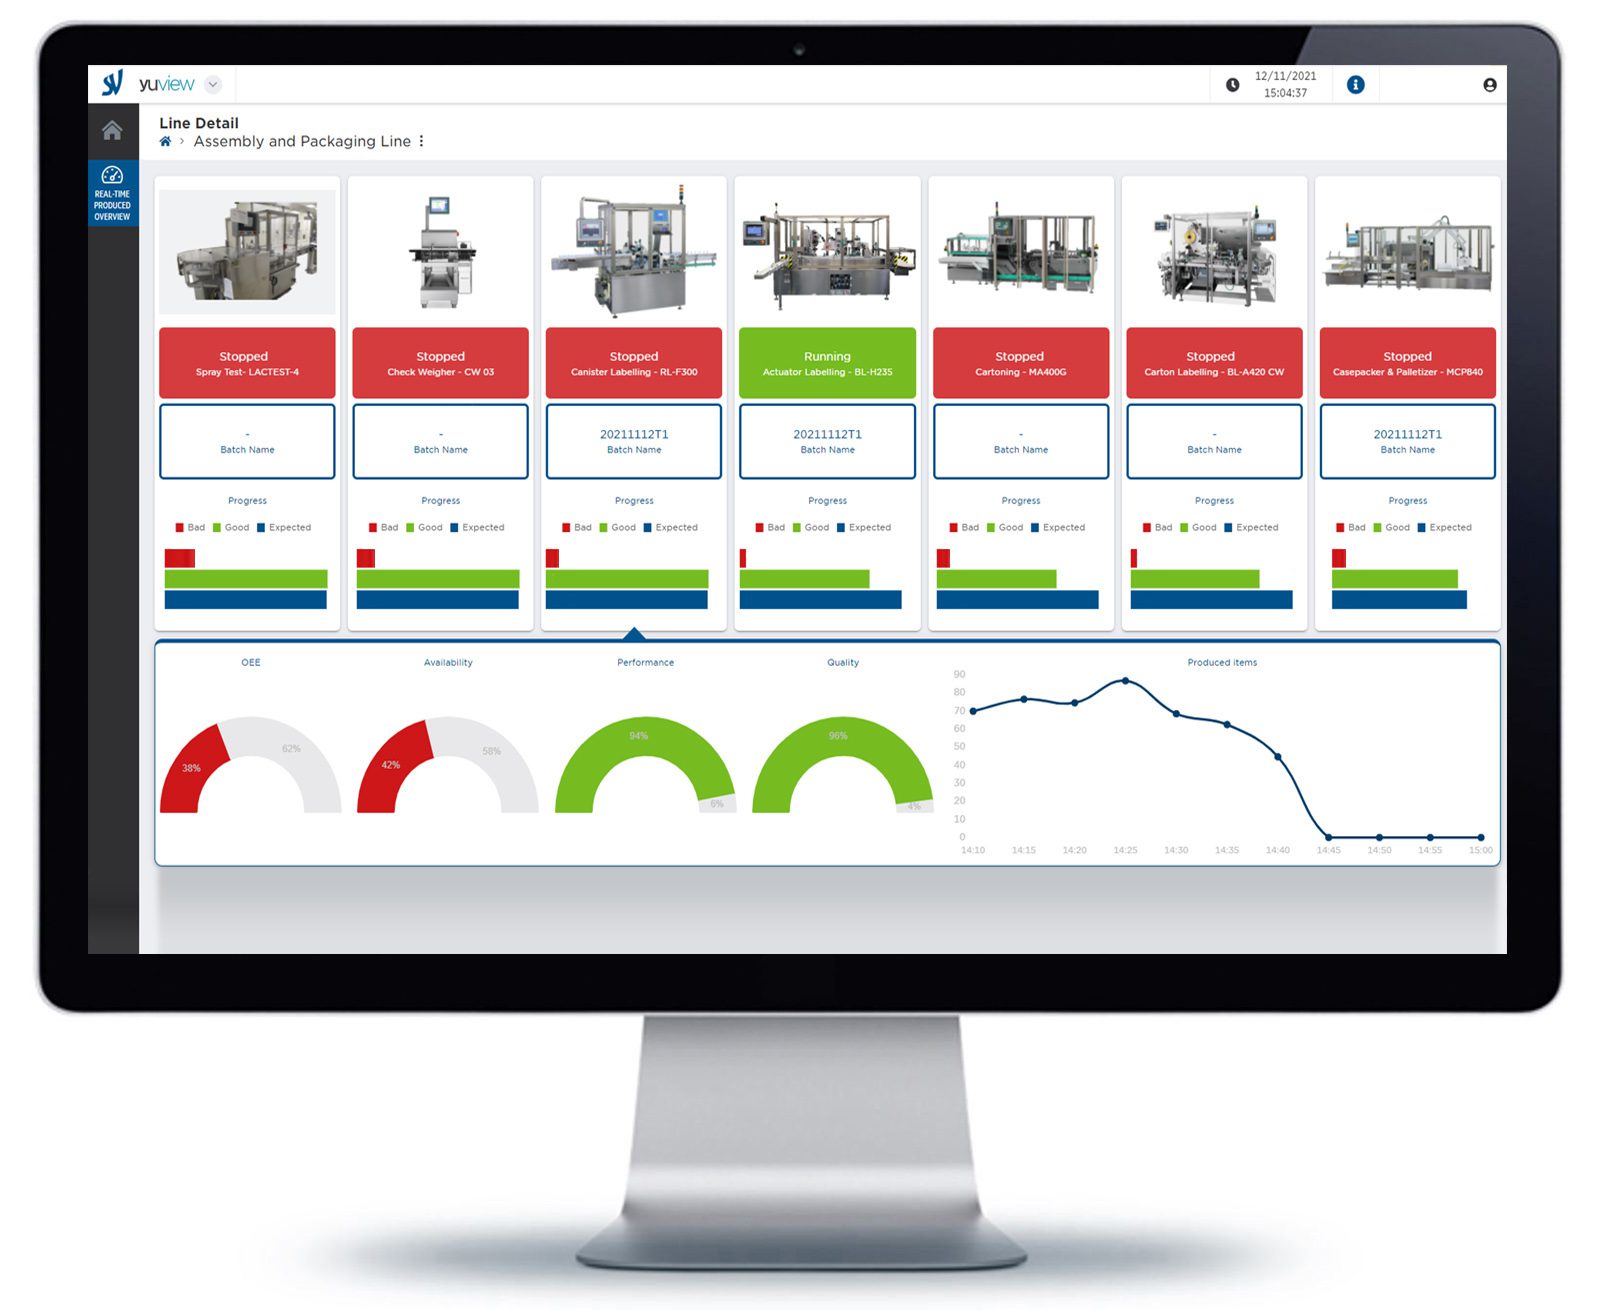
Yudoo provides a user-friendly OEE software that displays in real-time OEE dashboards with clear graphics (cakes, histograms and others) to monitor and improve the operations performances.
The solution performs OEE automated calculation, with results displayed in real-time dashboards. All the parameters are under control during every production phase and allow to immediately make decisions and actions for removing the causes of inefficiencies.
Historical OEE insights
Customizable Dashboards views
Early identification of bottlenecks and downtimes
Comprehensive and drill-down views of KPIs
User-oriented visualization of metrics
Yudoo gauges how a manufacturing process is performing, comparing the actual yield to the full potential, during the periods when it is scheduled to run. This allows to understand the time percentage when the manufacturing it’s effectively productive and understand the causes. Corrective actions can be, for example, a better selection of materials used, a proper training planning for employees.
Some examples of dashboards indicators
Some examples of indicators and information that can be displayed on the OEE software dashboards are:
- Asset information (Machine/s Status, Notifications, Alarms, reasons of downtimes)
- Production indicators, for example physical parameters (temperature, pressure, current absorption)
- Machine performance indicators such as quantities produced, rejects, speed, expected and actual times, duration
- OEE indicators, to understand the actual performance levels
The data acquisition on all the latest-generation machines that use open communication protocols (OPC-DA, OPC-UA, MQTT, Modbus, and others) is performed by yudoo automatically. Otherwise, in case of older equipments and packaging machines, an IoT Kit is provided to make the data collection possible.
Standard and customized views for each need
The dashboard views are infinitely customizable, to answer each specific need – otherwise, some standard views are also available with the most common pre-configured parameters.
Inefficiencies insights at a glance
In order to prevent possible downtimes, relying on employees’ skills might be not enough. Yudoo OEE dashboards offers an overview of the main performance indicators (KPIs) in real-time, allowing to monitor the progress of production and individuate possible inefficiencies. The visualization of dashboards allows getting a holistic overview of all assets monitored in a site, up to a granular view of the indicators of specific machine indicators.
Real-time decision making
Yudoo calculates OEE and its components (availability, performance and quality) in real-time, to address efficiency issues exactly where they are. In this way, it is possible to understand how the production is performing, directly during the batch running.
Historical analysis
Real time OEE data are just the tip of the iceberg. With yudoo dashboards, it’s possible to understand historical insights with more detail and accuracy than ever before.
Historical data collected on yudoo are used to perform OEE analysis on past occurrences, to drill down inefficiencies, to compare efficiency between equipments, and find out hidden information. Yudoo dashboards provide well-organized charts and analytical graphs to visualize this huge amount of data and their relationships, drastically improving the time needed and the ability to understand complex information and finding hidden improvement opportunities.
Features and compliance
The system is specifically designed for the pharmaceutical market, and it is compliant with the industry regulations, with user access regulated by FDA 21 CFR part 11 and annex 11. All events are registered by the software in an audit trail file to keep track of all the security-relevant activities.
The continuous Software development follows Gamp 5, to always improve products quality and consistency.
↓ Click below to discover all the other features of YUDOO FOR DATA ANALYSIS ↓

SEA Vision provides an extensive product portfolio of natively integrated solutions. Vision, traceability and data management solutions for pharmaceutical packaging lines are developed with a common approach to obtain a seamless ecosystem.


